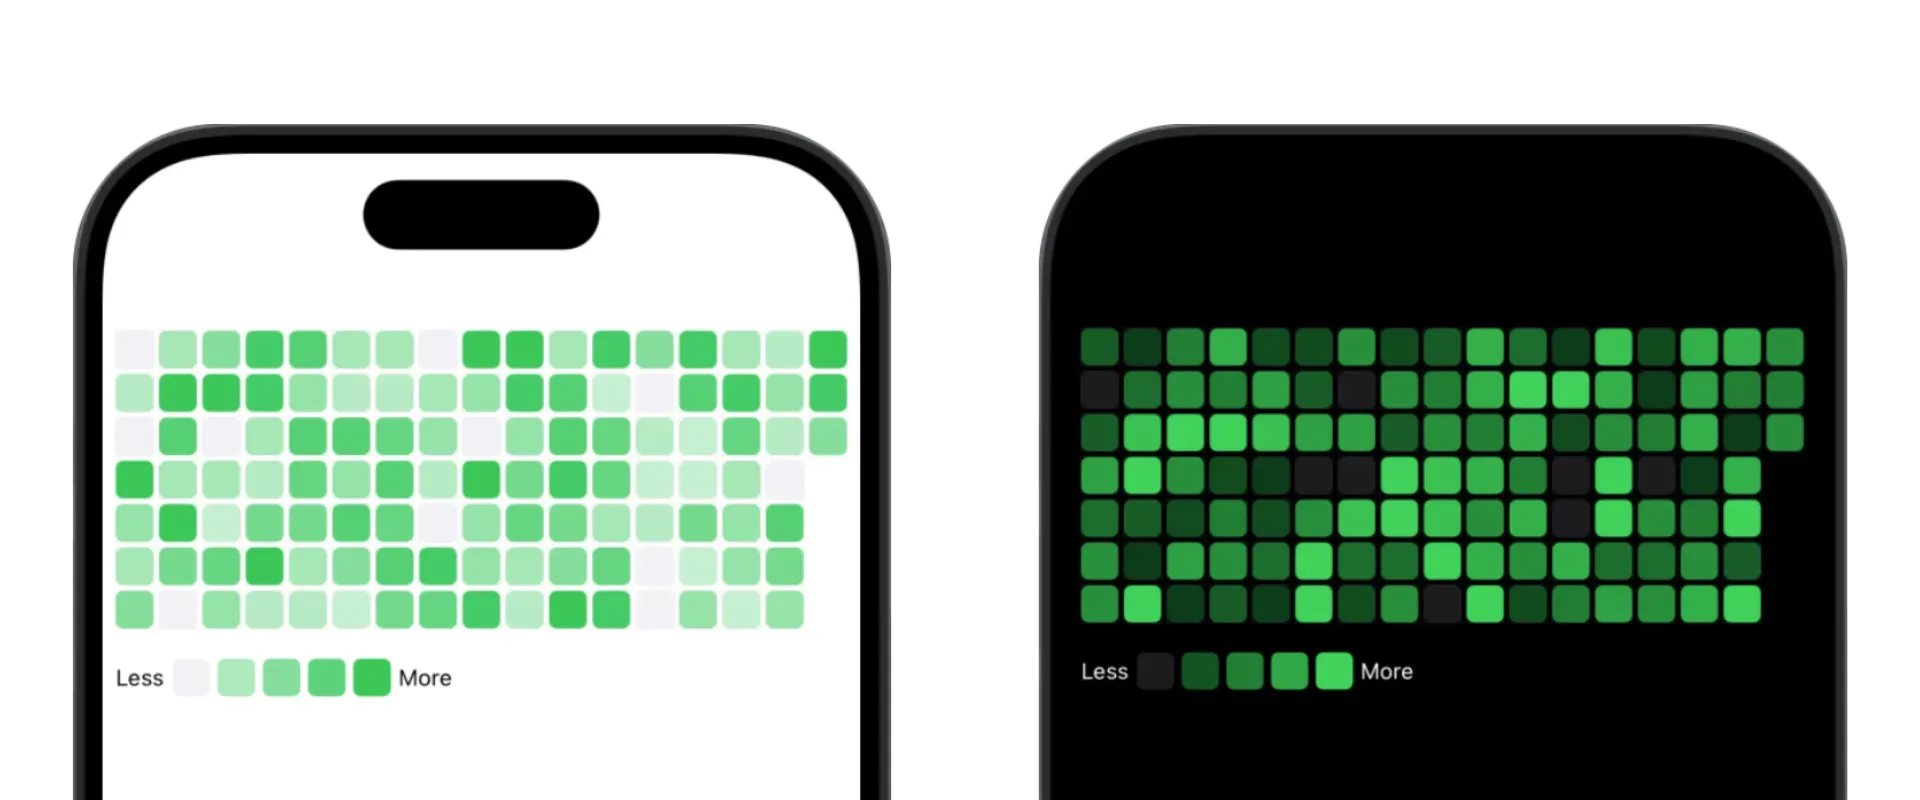
GitHub’s contribution graph has become an iconic way to visualize activity over time. In this tutorial, we’ll build a ContributionChartView component in SwiftUI that mimics the familiar green squares in GitHub’s contribution graph. This component can be used to effectively visualize a wide range of activity data, from personal goals to team productivity.
What We’ll Build
Our ContributionChartView component takes an array of Contribution values, organizes them into a grid layout, and uses a color gradient to represent the “contribution” intensity of each cell.
Before diving into the code, let’s outline our key goals for this project:
Key Features:
- Customizable Time Span: Choose how many weeks to display.
- Flexible Start of Week: Set the start day of the week (e.g., Sunday or Monday).
- Adjustable Cell Attributes: Customize color, size, spacing, and corner radius.
- Optional Legend: Toggle an intensity scale to enhance understanding.
Now that we have a clear understanding of what we’re building, let’s explore the technical implementation.
Structuring the ContributionChartView
We’ll start by defining the structure of our ContributionChartView and the supporting data types:
struct ContributionChartView: View {
    let contributions: [Contribution]
    let weeks: Int
    let firstDayOfWeek: WeekDay
    let targetValue: Double
    let cellColor: Color
    let emptyCellColor: Color
    let cellSize: CGFloat
    let cellSpacing: CGFloat
    let cellCornerRadius: CGFloat
    let showLegend: Bool

    private let calendar: Calendar
}

struct Contribution {
    let date: Date
    let count: Double
}

enum WeekDay: Int {
    case sunday = 1, monday, tuesday, wednesday, thursday, friday, saturday
}The ContributionChartView struct takes several parameters that define the input data, layout, and visual appearance of the contribution chart:
contributions: An array ofContributionstructs, each representing a contribution on a specific date with a count value.weeks: The number of weeks to display in the chart.firstDayOfWeek: The day of the week that the chart should start with (e.g., Sunday or Monday).targetValue: The maximum value in the dataset, used to scale the color intensity of each cell.cellColor: The color used for cells with contributions.emptyCellColor: The color used for cells without contributions.cellSize,cellSpacing,cellCornerRadius: The size, spacing, and corner radius of each cell in the grid.showLegend: A boolean flag to determine whether the legend should be displayed.
Initializing the Calendar
To ensure the correct grid layout based on the user’s preferred start of week, we set up a Calendar instance with a customizable firstDayOfWeek:
struct ContributionChartView: View {
    // ...
    init(
        firstDayOfWeek: WeekDay = .sunday,
        // other parameters
    ) {
        // ...
        var calendar = Calendar.current
        calendar.firstWeekday = firstDayOfWeek.rawValue
        self.calendar = calendar
    }
}In this code, we create a new Calendar instance and set its firstWeekday property to the rawValue of the firstDayOfWeek parameter. This ensures that the grid layout in the contribution chart will start on the user’s preferred day of the week.
Defining the Grid Data Structure
Next, we’ll define a helper struct, ContributionCell, to represent each cell in the grid. Each cell will hold its position, date, and contribution intensity based on the corresponding data value.
struct ContributionCell: Identifiable {
    let id = UUID()
    let row: Int
    let column: Int
    let value: Int
    let date: Date
    let intensity: Double

    init(date: Date, value: Int, targetValue: Double, startOfWeek: Date, firstDayOfWeek: WeekDay) {
        let calendar = Calendar.current
        self.date = date
        self.value = value

        let weekday = calendar.component(.weekday, from: date)
        let firstDayOffset = firstDayOfWeek.rawValue
        row = (weekday - firstDayOffset + 7) % 7

        let weeks = calendar.dateComponents([.weekOfYear], from: startOfWeek, to: date).weekOfYear ?? 0
        column = weeks

        intensity = min(Double(value) / targetValue, 1.0)
    }
}We then create the chartData array, which is an array of ContributionCell instances representing the contributions over the specified time range:
struct ContributionChartView: View {
    // ...
    private var chartData: [ContributionCell] {
        let today = Date()
        var dateComponents = calendar.dateComponents([.yearForWeekOfYear, .weekOfYear], from: today)
        dateComponents.weekOfYear = (dateComponents.weekOfYear ?? 0) - weeks + 1
        let startDate = calendar.date(from: dateComponents)!

        let contributionsDict = Dictionary(
            grouping: contributions,
            by: { calendar.startOfDay(for: $0.date) }
        ).mapValues { $0.reduce(0) { $0 + $1.count } }

        var cells: [ContributionCell] = []
        var currentDate = startDate

        while currentDate <= today {
            let startOfDay = calendar.startOfDay(for: currentDate)
            cells.append(ContributionCell(
                date: startOfDay,
                value: contributionsDict[startOfDay] ?? 0,
                targetValue: targetValue,
                startOfWeek: startDate,
                firstDayOfWeek: firstDayOfWeek
            ))

            currentDate = calendar.date(byAdding: .day, value: 1, to: currentDate)!
        }

        return cells
    }
}In this code, we first calculate the startDate for the chart based on the weeks parameter and the current date. We then group the contributions array by the start of each day, summing up the contribution counts for each day.
Next, we loop through the days from the startDate to the current date, creating a ContributionCell for each day and adding it to the cells array. The ContributionCell struct is responsible for calculating the row, column, and intensity value for each cell based on the contribution data and the firstDayOfWeek setting.
This chartData array serves as the data source for rendering the contribution chart grid.
Building the View’s Body
The body of our ContributionChartView contains a vertically stacked grid for the contributions, along with an optional legend at the bottom:
struct ContributionChartView: View {
    // ...
    var body: some View {
        VStack(alignment: .leading, spacing: 16) {
            HStack(alignment: .top, spacing: cellSpacing) {
                ForEach(0 ..< weeks, id: \.self) { week in
                    VStack(spacing: cellSpacing) {
                        ForEach(0 ..< 7) { row in
                            if let cell = chartData.first(where: { $0.column == week && $0.row == row }) {
                                Rectangle()
                                    .fill(colorForIntensity(cell.intensity))
                                    .frame(width: cellSize, height: cellSize)
                                    .clipShape(RoundedRectangle(cornerRadius: cellCornerRadius))
                                    .overlay(
                                        Rectangle()
                                            .stroke(Color.gray.opacity(0.1), lineWidth: 1)
                                    )
                            }
                        }
                    }
                }
            }

            if showLegend {
                HStack(spacing: 4) {
                    Text("Less")
                        .font(.caption)

                    ForEach(0 ..< 5) { i in
                        Rectangle()
                            .fill(colorForIntensity(Double(i) / 4.0))
                            .frame(width: cellSize, height: cellSize)
                            .clipShape(RoundedRectangle(cornerRadius: cellCornerRadius))
                    }

                    Text("More")
                        .font(.caption)
                }
            }
        }
        .padding()
    }

    private func colorForIntensity(_ intensity: Double) -> Color {
        intensity == 0 ? emptyCellColor : cellColor.opacity(0.2 + intensity * 0.8)
    }
}
In this code, we first create a grid of contribution cells using nested HStack and VStack views. Each cell is represented by a Rectangle view, with its color intensity determined by the colorForIntensity function.
The colorForIntensity function takes a value between 0 and 1, representing the contribution intensity, and returns a color in the specified gradient. Cells with no contributions are rendered using the emptyCellColor.
If the showLegend flag is set to true, we also display a legend at the bottom of the chart. The legend is a horizontal stack of rectangles, each representing a different contribution intensity level, with the “Less” and “More” labels on either side.
Adding Platform Specific Colors
To ensure a consistent look and feel across macOS, iOS, and watchOS, we define some custom colors with platform-specific defaults:
extension Color {
#if os(macOS)
    static let background = Color(NSColor.windowBackgroundColor)
    static let secondaryBackground = Color(NSColor.underPageBackgroundColor)
    static let tertiaryBackground = Color(NSColor.controlBackgroundColor)
#endif
#if os(iOS)
    static let background = Color(UIColor.systemBackground)
    static let secondaryBackground = Color(UIColor.secondarySystemBackground)
    static let tertiaryBackground = Color(UIColor.tertiarySystemBackground)
#endif
#if os(watchOS)
    static let background = Color.black
#endif
}This extension allows us to use platform-specific colors for the background, secondary background, and tertiary background, ensuring that the ContributionChartView looks and feels at home on any Apple platform.
Usage Example
Here’s an example of how to use the ContributionChartView:
struct ContentView: View {
    let calendar = Calendar.current
    let today = Date()
    let weeks = 16
    let sampleData: [Contribution] = (0..<7*weeks).map { dayOffset in
        let date = calendar.date(byAdding: .day, value: -dayOffset, to: today)!
        return Contribution(date: date, count: Int.random(in: 1...5))
    }

    ContributionChartView(
        contributions: sampleData,
        weeks: weeks,
        firstDayOfWeek: .sunday,
        targetValue: 4,
        cellColor: .green,
        emptyCellColor: .secondaryBackground
    )
}Conclusion
The ContributionChartView provides a powerful, customizable SwiftUI component for visualizing contributions, goals, or any data suitable for a grid format. This project demonstrates SwiftUI’s flexibility with data-driven layouts and gradient styling, opening the door to more complex data visualizations.
You can find the full source code on GitHub.